Summary |
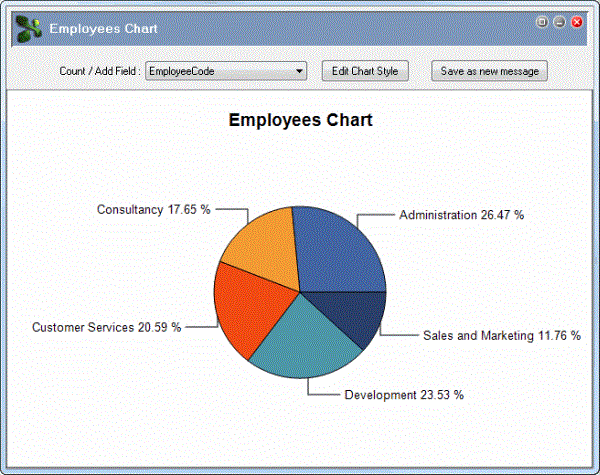
After you group records in a grid, you can right-click and select Generate Chart to create a pie chart (default option) of your data.For information on grouping columns. |
Example |
This example explains how to create a pie chart of employees by departments.
|

Save as New Message |
Click this button to display the standard Report Destination form with Destination options, E-mail options, File options, Transfer options and Document options tabs. You can export the image file in the following formats: GIF, JPEG, PDF, PNG, HTML, Bitmap and Metafile. We recommend saving the chart as a PDF to render the chart correctly and clearly. You can also export chart data in tabular format to TXT, XLS, and CSV files. |
Edit Chart Style |
Click this button to display the PayGlobal Chart Editor. You can change the graph type and select a pre-defined colour palette by clicking the Change button on the Chart tab | Series sub-tab from the TeeChart Gallery form. |
TeeChart Gallery |
The TeeChart Gallery form contains 12 types of charts, but you can only select charts that are suitable for the type of data you are reporting on.
|